Over the course of History 723, we have investigated the inception and parameters of the Anthropocene and the scholarly discourse surrounding this new (and rather controversial) geological epoch. I entered the course with some hesitation, mainly due to the fact that I do not have a background in environmental history. However, as our discussions continued, I began to feel more comfortable discussing this unprecedented era of human ecological impact. Nevertheless, I am left with a lot more questions than answers.
History 723 began with rather lofty intentions. Between the three of us graduate students and Dr. Michael Egan, we hoped to not only explore the Anthropocene in its relation to history, but also to construct a digital project that represented, challenged, or problematized the Anthropocene in some way, shape, or form. Due to our rather limited digital skill set and minimal timeline, our collaborative project took the form of this very blog and associated podcast series. In the end, we collectively discussed a variety of themes, topics, and theories developed by a variety of scholars from varying fields. Yet, this small bibliographic sample only skims the surface of the ongoing conversation concerning the Anthropocene. How have historians as a whole discussed the new epoch? What can we discern from the historiography of the Anthropocene?
Historiographical analyses are never a simple task, especially in our current state in which new scholarly content appears in a variety of media and at a phenomenal pace and scale. Many historians and scholars alike have found solace in the Google Ngram Viewer, a facet of Google Books. The Ngram Viewer allows users to input any term(s) and discover the usage of said term (or phrase) in published texts throughout history. For example, an Ngram evaluation for the term “Anthropocene” sees the following result:
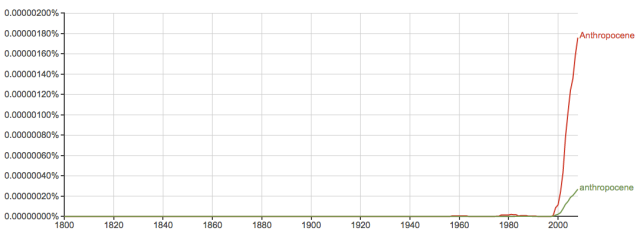
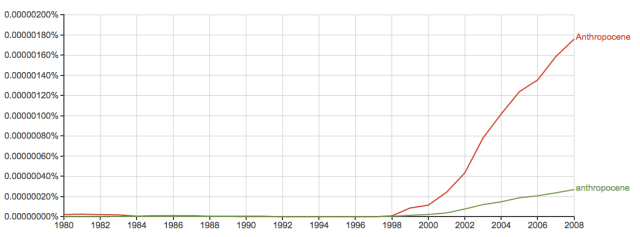
Unsurprisingly, since the term Anthropocene (in its modern sense) was not popularized until 2000 by Paul Crutzen, this initial visualization has quite a bit of ’empty’ graphic space. By altering the timescale, it is clear that literary discussions surrounding the Anthropocene are gaining prominence at a rapid rate:
While the Google Ngram Viewer is a useful tool for visualizing word usage across time, it is not particularly useful for discerning historiographical trends. The above diagrams visualize the term Anthropocene across the entire Google Books library, including many texts outside of the historical discipline. Can we possibly find the historian’s voice within this data set? More specifically, can we highlight the voices of environmental historians and their relationship with the Anthropocene?
Digital history research methods can assist in answering the questions found above. The following demonstration uses Mathematica, a sophisticated programming language, to build a personalized Ngram Viewer that focuses directly on historical texts rather than the entire collection housed at Google Books. The development of this tool began at Western University for Dr. Rob MacDougall‘s graduate American Historiography course. Rob and I worked together to build an Ngram viewer that analyzed all the book reviews published through the Mississippi Valley Historical Review and the Journal of American History. This project would not have been successful without the guidance and expertise provided by Dr. Bill Turkel.
This DIY Ngram Viewer makes use of the datasets provided through JSTOR: Data For Research. Due to copyright laws, it is difficult to access the entire collection of texts associated with an academic journal. However, JSTOR DFR permits users to batch download metadata connected to a wide variety of scholarly publications. Therefore, with very little effort, one can access the collective word counts, bigrams, trigrams, and keywords for a particular article, journal issue, or even across a particular timespan. While open accessibility, copyright, and restrictive pricing continue to be contentious issues across academia, JSTOR DFR encourages big data analysis in a completely cost-free manner.
In Rob’s American Historiography course, we chose to use the MVHR and AHR in order to track historiographical trends in American history due to the notability, popularity, and prestige associated with these publications. In the case of History 723, I chose to analyze Environmental History, a leading journal that discusses human interactions with nature. Environmental History began publication in 1996 and continues to produce quarterly issues, thereby coinciding with the similar chronology of discussions surrounding the Anthropocene. Of course, this same demonstration can be replicated with any other journal housed at JSTOR DFR.
The following post walks through the coding process to develop a personal Ngram viewer as well as a discussion of preliminary findings concerning the historiography of the Anthropocene.
Downloading Metadata from JSTOR: Data for Research
Start by creating a free account with JSTOR DFR. Select any quantifier (journal, keyword, date range, etc.) you wish to analyze by setting your search parameters. Once you are happy with the selected dataset, click Dataset Requests in the upper right hand corner and and select, Submit new request.
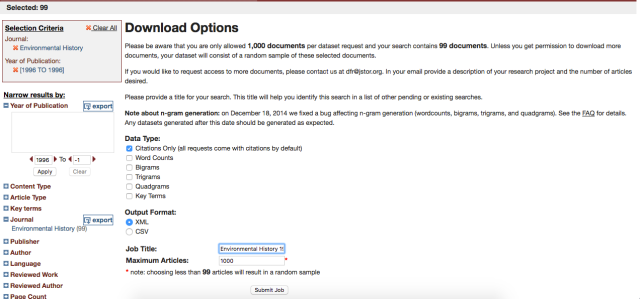
On the following screen, select the metadata you wish to download from the list of data types. JSTOR DFR exports either .xml and .csv files. To follow this tutorial, select .csv as the file format.
Assign a Job Title to the download request and select the amount of articles to analyze. JSTOR DFR allows a maximum of 1000 articles to be analyzed in a single download set. In the case of Environmental History, JSTOR DFR has 2045 articles on file. The entire article collection cannot be accessed in a single download. However, for the purposes of building a DIY Ngram viewer, download files in one-year spans in order to establish a consistent chronological increment for the final graph.
NOTE: There is a small glitch in the JSTOR DFR interface that does not allow for a single year to be selected from the “Year of Publication” sidebar tool. To solve this problem, simply adjust the desired time range within the URL in the navigation bar. Reload the page and continue with the download request.
The download process is not immediate and will take anywhere from minutes to hours depending on the workload of the JSTOR DFR servers. To access the download request, select Data Requests and List prior requests. On this page, every requested download is listed. Find the appropriate dataset and under the full dataset column, select Download (1000 docs). This action will download a .zip file to your hard drive. Unzip the file to access the documents. You have successfully downloaded your first data set! In the case of Environmental History, I downloaded a unique dataset for each year from 1996-2013.
Importing Data into Mathematica and Generating A DIY Ngram Viewer
For the following instructions, I will simply post the code used to import the .csv files into Mathematica, organize the data, and input said data into an Ngram viewer. If you are new to Mathematica many of these functions may seem foreign. Should you require any assistance be sure to take advantage of a number of fantastic online resources. Experienced Mathematica users are always happy to assist newcomers on Mathematica Stack Exchange. Furthermore, Bill Turkel’s Digital Research Methods with Mathematica (2015) is a great online resource for mastering digital history techniques in this unique and powerful programming language.
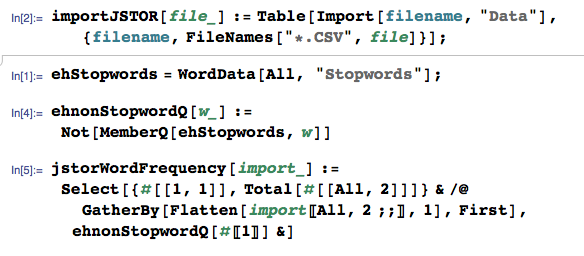
The functions pictured below perform the following tasks:
importJSTOR[file_] : Imports the selected file path into Mathematica.
ehStopwords : Refers to a collected list of stopwords.
ehNonStopwordQ[w_] : Refers to all words within a dataset, except those found in the ehStopwords list.
jstorWordFrequency[import_] : Removes header from .csv data, flattens nested lists, and removes stopwords. This function, when evaluated, results in a list of words with their associated word frequency tally for the selected dataset.
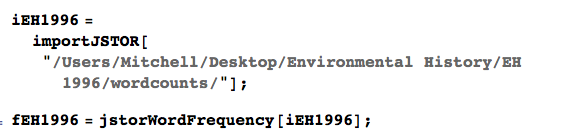
Using the above functions, import each dataset (i.e., one-year) under a new function, and evaluate each imported dataset through jstorWordFrequency. In the case of Environmental History, I evaluated each dataset from 1996-2013 as a unique function.
At this stage, we have imported all the necessary data into Mathematica and formatted said data to create a suitable Ngram viewer. The next step is to build viewer itself with the code found below.
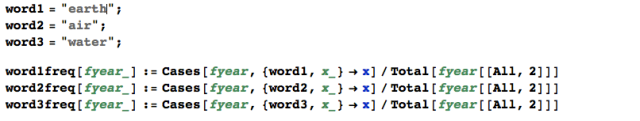
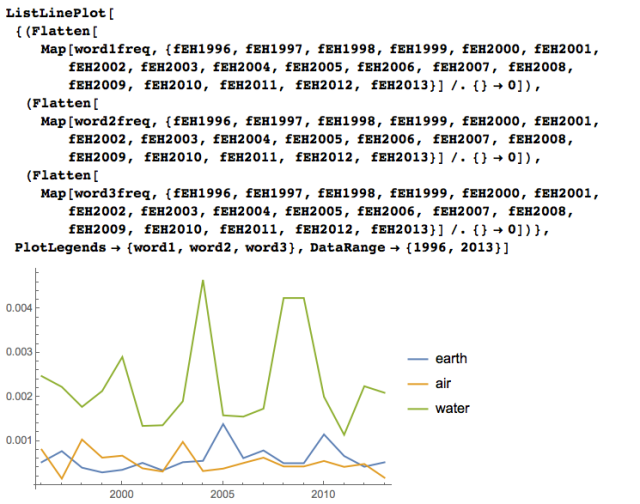
Our code has successfully analyzed the word frequencies for each year of Environmental History and displayed the results in a simple line graph. In the above example, the graph displays values for the terms “earth”, “air”, and “water”. However, you can enter any term, much in the same manner as Google Ngram Viewer. No matter the chosen term(s), this DIY Ngram Viewer will analyze the data of all 2045 articles published by Environmental History from 1996 to 2013.
Analyzing Environmental History Using A DIY Ngram Viewer
The initial example comparing earth, air, and water suggests that articles within Environmental History tend to discuss water more than earth and air. However, the use of “earth” and “air” occurs at a much steadier pace than “water” which experiences high peaks and sudden declines.
How frequently do authors for Environmental History discuss the Anthropocene?
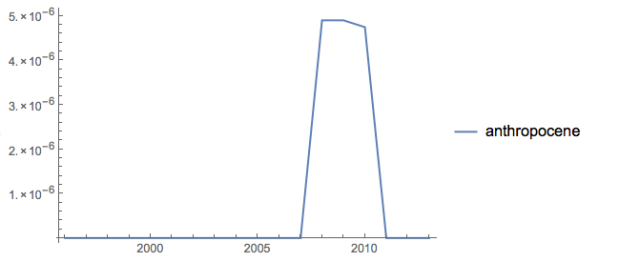
The Anthropocene does not appear to be a hot topic for Environmental History, or at least not a very popular one, with only a short burst of interest for a few years. However, the term Anthropocene itself is rather limited. How about discussions of the “anthropocentric”?
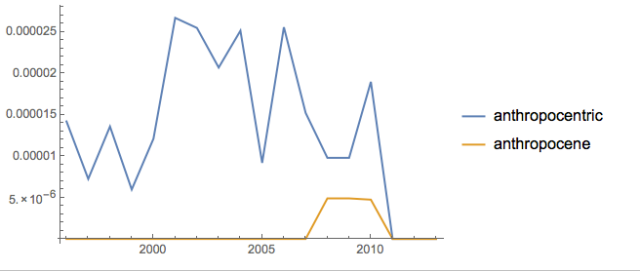
The “anthropocentric” is a much more popular term which is to be expected. The Anthropocene refers to a newly introduced geological epoch that rests on human influences on ecological processes. The “anthropocentric” on the other hand, simply refers to humans as a central force of more importance than any other life form or element. Therefore, although the Anthropocene may not be a direct point of discussion in Environmental History, themes surrounding the Anthropocene are certainly discussed.
How does the Anthropocene compare to other geological periods?
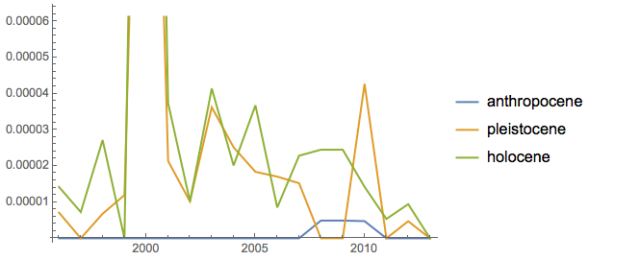
In this case, the use of “Pleistocene” and “Holocene” differs so vastly from “Anthropocene” that the data cannot fit within the same visual range. This might also reflect the current attitude of scholars and environmental historians. The Anthropocene is a highly contested designation that has yet to fully permeate scholarship and see extensive use.
However, our Ngram explorations are not limited to these geological epochs. If we are particularly interested in the “anthropocentric”, how might the Ngram viewer be useful to demonstrate the concept of human centrality? In this case, we might be interested in exploring the usage of terms such as “human”, “plant” and “animal”.
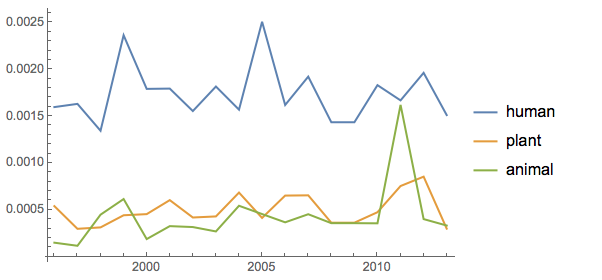
Once again, the word usage trends amongst environmental historians seem to support an anthropocentric leaning.
However, it is important to pause here to discuss the utility of Ngram viewers and shortcomings associated with this type of digital tool. In this DIY Ngram viewer, there are a number of limitations.
First, I am fully relying on the data provided by JSTOR DFR which is not always perfect. The OCR performed on JSTOR articles varies in accuracy and often delivers subpar results. Therefore, the data displayed in the Ngram viewer itself is not inherently accurate.
Second, I have only evaluated for Enivornmental History and am thereby limited to the data associated with this particular journal. In order to develop a more extensive and thorough visualization of scholarly discourse, one would need to download and organize a much larger and diverse dataset.
Third, this DIY Ngram viewer can only search single terms and does not recognize Boolean phrasing. Therefore, plurals or other variations of words are recognized as separate entities. As a result, conclusive deductions such as “historians discuss humans more than plants and animals“ are highly problematic since the data these flimsy statements refer to is inherently skewed.
With these limitations in mind, what are Ngram viewers good for?
I find Ngram viewers to be an important tool for preliminary historiographical research. By engaging with word frequencies across a dataset and associated timeline, you are able to explore how historians use terms in comparison to others. Ngram viewers also stimulate further questions based on anomalies or interesting visualizations. For example, why might Environmental History have explored the Anthropocene between 2006 – 2011 more than any other date range? Did something significant in relation to the Anthropocene and related scholarship occur during these years?
Personally, I used this very Ngram viewer to develop an idea for our final History 723 paper. I noticed that “air”–in relation to “water” and “earth”–was generally not a popular topic of discussion amongst environmental historians. Of course, I could not be sure of this assertion based on this initial Ngram evaluation, but the visualization itself encouraged me to think about a research question that I otherwise might not have found.
In this way, Ngram viewers and similar digital research tools are not a replacement for traditional history methods. In fact, one can derive very little accurate or conclusive information from Ngram evaluations (especially in a DIY model). However, Ngram viewers are incredibly useful tools for brainstorming and initial explorations of any given topic. These tools display trends across vast quantities of literature, which could not be accomplished by traditional means.
If the Anthropocene itself encourages individuals to embrace new ways of thinking in order to understand (and possibly mitigate) human impacts on ecological systems, Ngram viewers and similar digital tools might be a good place for historians to start.
Mitchell Horkoff